Complex graphs
In one of the math assignments your teacher asks you to plot the following function:
![notion image](https://www.notion.so/image/https%3A%2F%2Fs3-us-west-2.amazonaws.com%2Fsecure.notion-static.com%2Faf92305b-706f-4d1b-803c-c1a2802d9f0a%2FUntitled.png?table=block&id=50c4515e-819c-45ee-88fe-bc505206456c&cache=v2)
![notion image](https://www.notion.so/image/https%3A%2F%2Fs3-us-west-2.amazonaws.com%2Fsecure.notion-static.com%2Fc919fe66-8187-46bf-813d-510b7be43916%2FUntitled.png?table=block&id=3e07fed6-ff5d-4467-9994-9750c10abc68&cache=v2)
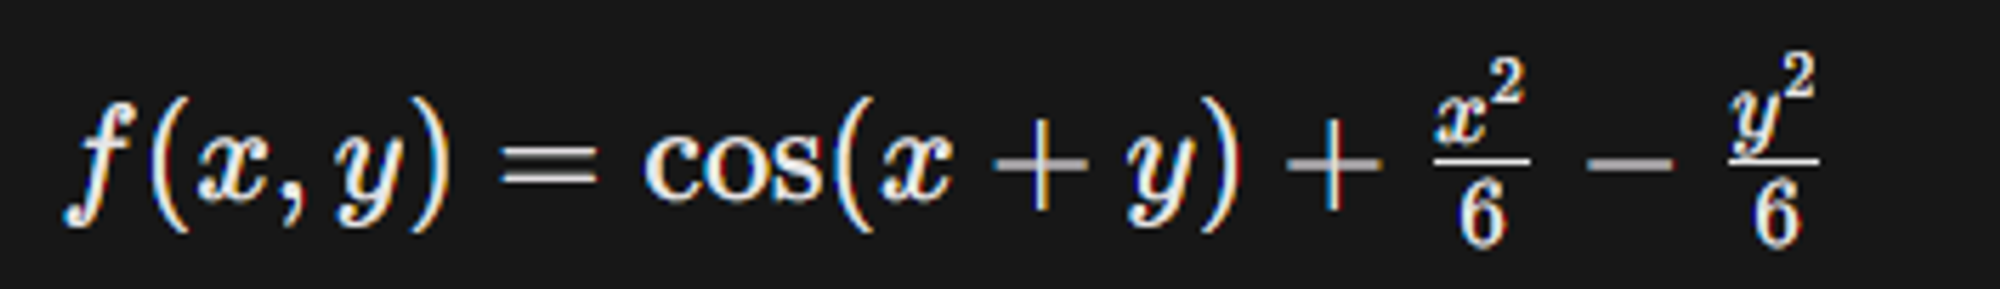
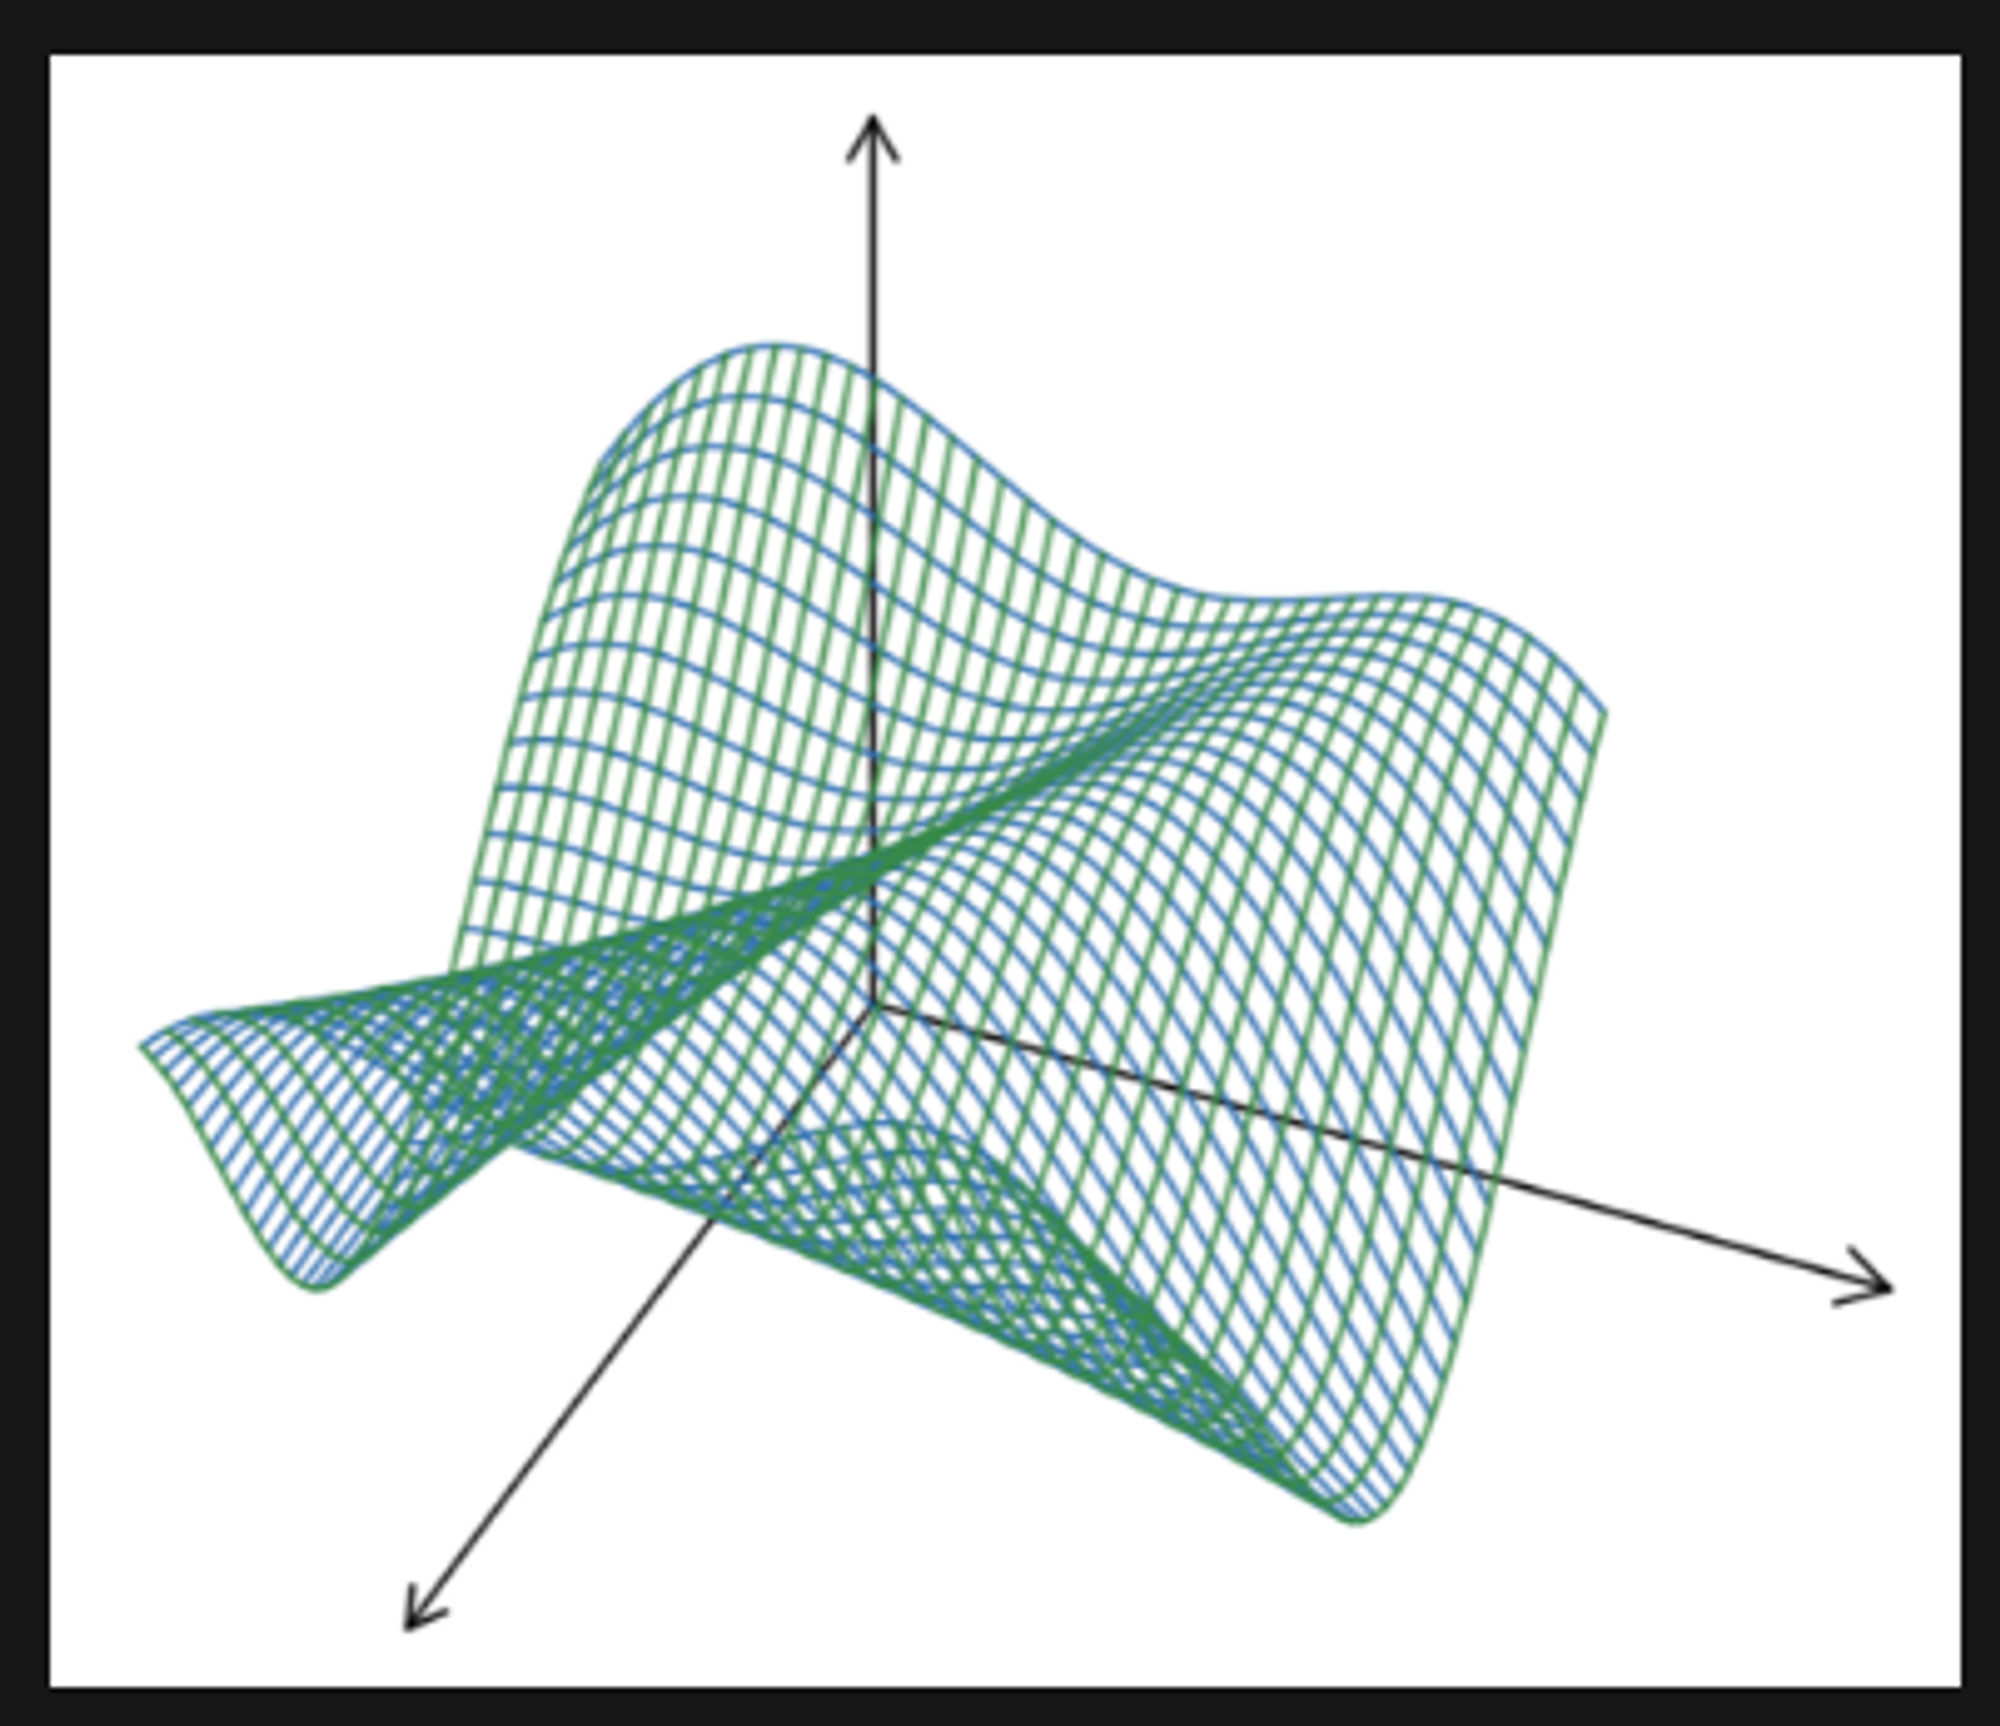
Knowing the software available online, you do it very quickly. Yet, your teacher asks you to write your own program that would print this graph.
For that, as a first step, you would need to know the value of the function at each possible (x,y) coordinate.
You decide to first write a program that given a single (x,y)coordinate, would print the value of the function.
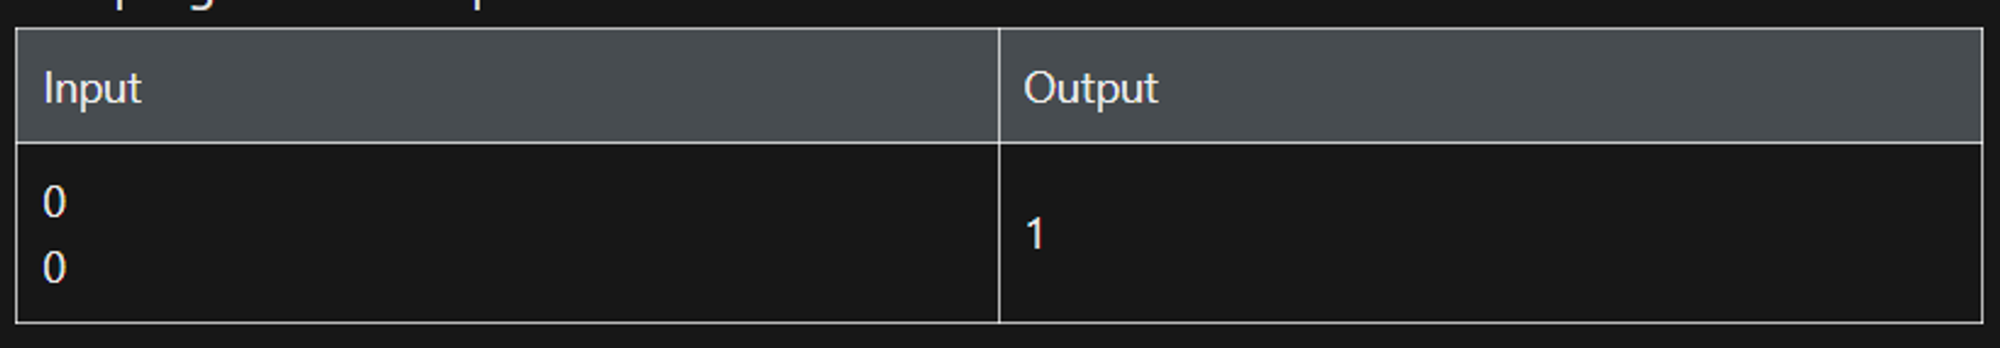
The input consists of two floating-point numbers
x
and y
.The program should print the value of the function written above.
![notion image](https://www.notion.so/image/https%3A%2F%2Fs3-us-west-2.amazonaws.com%2Fsecure.notion-static.com%2F6a4226e4-9069-48e0-935b-a02fb73cb64c%2FUntitled.png?table=block&id=eb75f5bc-e9d7-4db1-8643-dd942dbbb1c5&cache=v2)
Constraints
Time limit: 0.2 seconds
Memory limit: 512 MB
Output limit: 1 MB